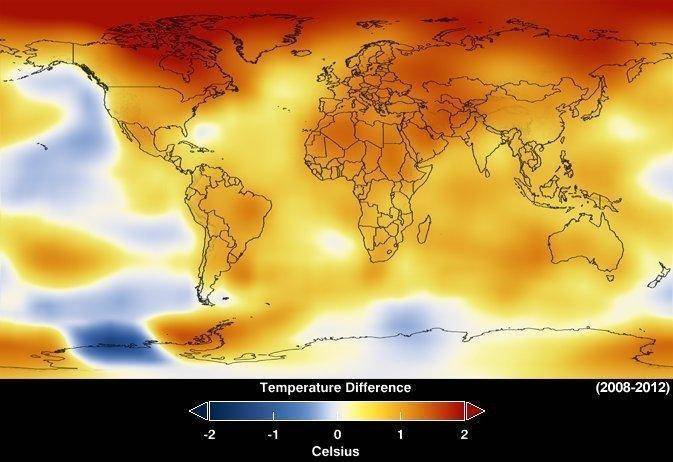
NASA scientists say 2012 was the ninth warmest of anyВ year since 1880, continuing a long-term trend of rising globalВ temperatures. With the exception of 1988, the nine warmest years inВ the 132-year record all have occurred since 2000, with 2010 and 2005В ranking as the hottest years on record.
NASA’s Goddard Institute for Space Studies (GISS) in New York, whichВ monitors global surface temperatures on an ongoing basis, released anВ updated analysis Tuesday that compares temperatures around the globeВ in 2012 to the average global temperature from the mid-20th century.В The comparison shows how Earth continues to experience warmertemperatures than several decades ago.
The average temperature in 2012 was about 58.3 degrees FahrenheitВ (14.6 Celsius), which is 1.0 F (0.6 C) warmer than the mid-20thВ century baseline. The average global temperature has risen about 1.4
degrees F (0.8 C) since 1880, according to the new analysis.
Scientists emphasize that weather patterns always will causeВ fluctuations in average temperature from year to year, but theВ continued increase in greenhouse gas levels in Earth’s atmosphere
assures a long-term rise in global temperatures. Each successive yearВ will not necessarily be warmer than the year before, but on theВ current course of greenhouse gas increases, scientists expect each
successive decade to be warmer than the previous decade.
“One more year of numbers isn’t in itself significant,” GISSВ climatologist Gavin Schmidt said. “What matters is this decade isВ warmer than the last decade, and that decade was warmer than the
decade before. The planet is warming. The reason it’s warming isВ because we are pumping increasing amounts of carbon dioxide into the
atmosphere.”
Carbon dioxide is a greenhouse gas that traps heat and largelyВ controls Earth’s climate. It occurs naturally and also is emitted byВ the burning of fossil fuels for energy. Driven by increasing man-made
emissions, the level of carbon dioxide in Earth’s atmosphere has beenВ rising consistently for decades.
The carbon dioxide level in the atmosphere was about 285 parts perВ million in 1880, the first year in the GISS temperature record. ByВ 1960, the atmospheric carbon dioxide concentration, measured atВ NOAA’s Mauna Loa Observatory, was about 315 parts per million. Today,В that measurement exceeds 390 parts per million.
While the globe experienced relatively warm temperatures in 2012, theВ continental U.S. endured its warmest year on record by far, accordingВ to NOAA, the official keeper of U.S. weather records.
“The U.S. temperatures in the summer of 2012 are an example of a newВ trend of outlying seasonal extremes that are warmer than the hottestseasonal temperatures of the mid-20th century,” GISS director JamesВ E. Hansen said. “The climate dice are now loaded. Some seasons stillВ will be cooler than the long-term average, but the perceptive personВ should notice that the frequency of unusually warm extremes isВ increasing. It is the extremes that have the most impact on peopleВ and other life on the planet.”
The temperature analysis produced at GISS is compiled from weatherВ data from more than 1,000 meteorological stations around the world,В satellite observations of sea-surface temperature, and Antarctic
research station measurements. A publicly available computer programВ is used to calculate the difference between surface temperature in aВ given month and the average temperature for the same place during
1951 to 1980. This three-decade period functions as a baseline forВ the analysis. The last year that experienced cooler temperatures thanВ the 1951 to 1980 average was 1976.
В
The GISS temperature record is one of several global temperatureВ analyses, along with those produced by the Met Office Hadley CentreВ in the United Kingdom and the National Oceanic and AtmosphericВ Administration’s National Climatic Data Center in Asheville, N.C.These three primary records use slightly different methods, butВ overall, their trends show close agreement.
В

